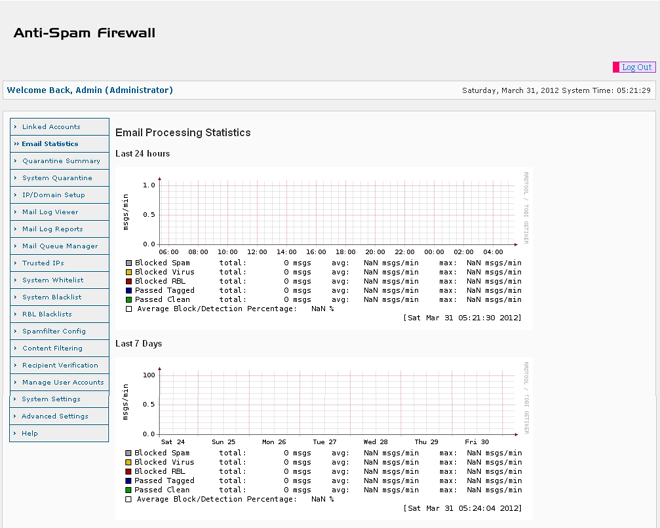
After logging into your SpamWall as the main admin user you will see a screen similar to the one below which provides an overview of email processing statistics on your system on a Last 24 hours, Last 7 Days, Last 30 Days and Last Year basis. (Note that depending on your SpamWall system model some of the items shown in the menu image below may not be available).

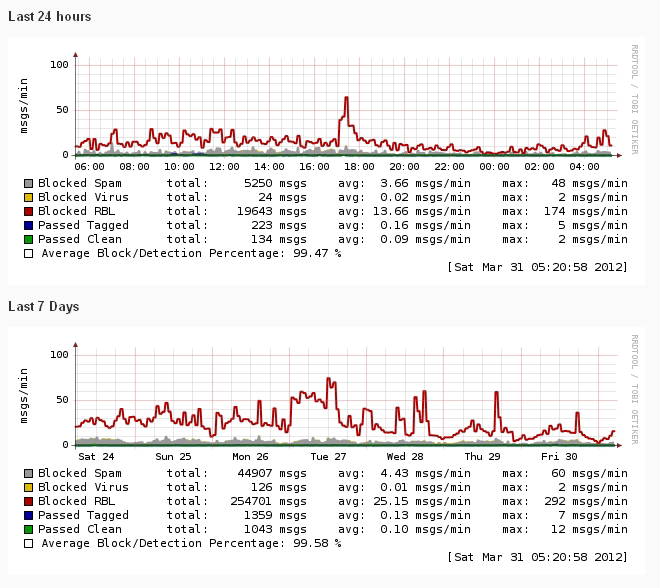
Once your SpamWall has started processing email the statistics graphs will start to look like the ones in the image below.

The Email Statistics screen provides a statistical and graphical overview of emails processed by the SpamWall system and their classification. The display includes the following:
| Blocked: Spam |
Number of emails detected and Blocked as Spam/UCE and sent to the System Quarantine. |
| Blocked: Virus |
Number of emails that have been detected as being Virus infected and blocked or sent to the System Quarantine. |
| Blocked: RBL |
Number of emails that have been blocked due to being in one of the active RBL/Blacklists. |
| Passed: Tagged |
Number of emails which have been found to be over the "Tag Level 2" value set in the Spamfilter Config (indicating probable Spam) and which have been forwarded on to the recipient with the '[SPAM?]' type tag appended to the Subject line of the message. |
| Passed: Clean |
Number of emails which have been found to be under the "Tag Level 2" value set in the Spamfilter Config and which have been forwarded on to the recipient unmodified and "Passed Clean" and therefore are unlikely to be Spam/UCE or Virus infected. |
| Average Block/Detection Percentage |
The percentage of emails either blocked or quarantined as Spam/UCE or Virus infected by the system. It is not unusual for this percentage to be over 90% in some cases as the amount of Spam as a percentage of global email traffic in recent years has been in the 70% - 90%+ range |
Note that the example statistics graphs shown here are from a "Spam trap" type system and as such the Spam Block/Detection percentage rate is very high at the 99.9%+ level however on most systems this percentage, which reflects the amount of email blocked or detected as Spam by the system compared to that "passed clean" as non-Spam, will be in the 60%-90% range depending in the type and content of email traffic being received and processed by the system.
The daily, or "Last 24 hours" statistics, are in "real time" and are updated at least every 5 minutes. The weekly, or "Last 7 Days" statistics are a running average total of the daily statistics for the past 7 days and the monthly or "Last 30 Days" statistics reflect a running average of the totals of all of the various email processing classifications processed by the system in the past 30 days.
Note that the Email Statistics output is not intended to be an exact "to the message" count of every single message processed by the system but rather in order to facilitate the graphical display output is an average calculation of indicated email processing activity based on a continual scanning carried out on the system mail logs to provide a indicative rather than exact representation of the email processing related activity which taking place on the system both in real time and on a historical type basis.
 Quarantine Summary